

The Centre for New Ideas published the third wave of its Telegram mapping on 8 September (report page, PDF, RU). Alexander Stukanau presented it at a webinar the next day, and Euroradio wrote it up the same evening under the headline that pro-regime channels are losing influence. The report covers 170,140 posts from 33 pro-regime channels between January 2025 and May 2026, plus 7,395 reposts between them. It is the largest published count of this segment. It is also the third team in a year to find the same channel at the top.
What the count shows
Two thirds of all reposts inside the network come from one channel: Pul Pervogo, the presidential press service account. BelTA makes 37% of all reposts and takes content from only three sources. ZhS Premium makes 16% and takes from sixteen. Pul Pervogo itself made 14 reposts in seventeen months. The report calls this a broadcasting tree rather than a network. One producer, two relays, and a periphery that repeats the flow without talking to itself. Reciprocity is low and clustering is close to zero.
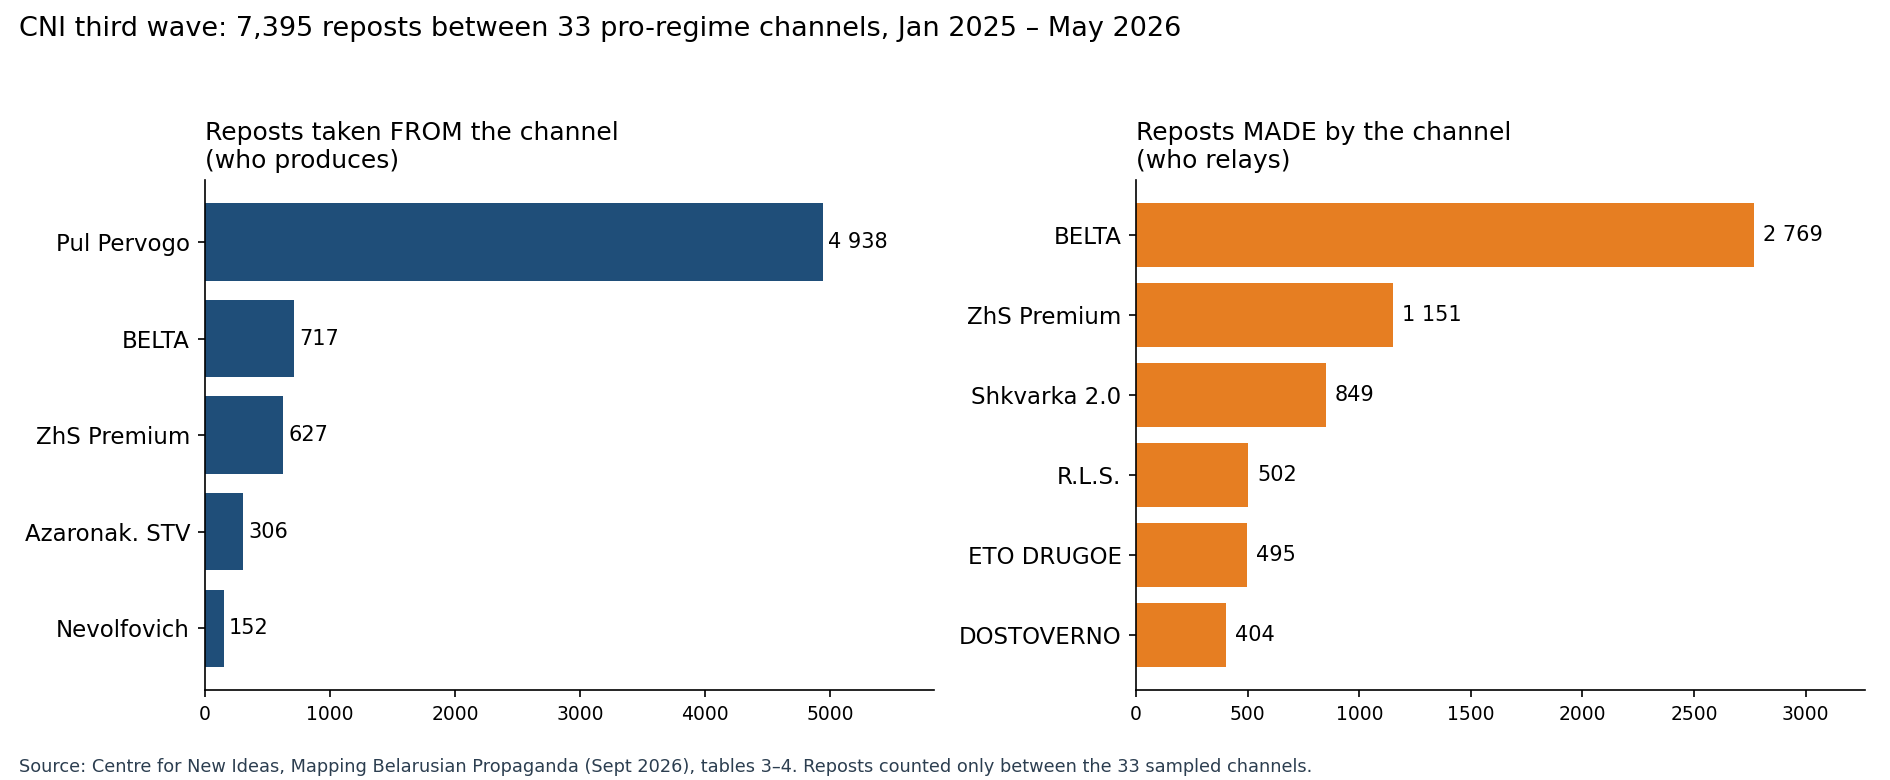
FORESIGHT reached the same apex in July from a different corpus. We took five personal channels (Azaronak, Tur, Dzermant, Shpakouski, Gigin) and counted every forward each of them made. Pul Pervogo was the most forwarded source for all five, 9,900 forwards in total. The Digital Freedoms Lab reached it a third way in August. In its eleven-channel sample it found 1,066 shared posts against four independent ones, with Nevolfovich and ZhS Premium as the upstream pair (Office Hours). Three teams, three samples, one apex. That part is settled.
Three teams, three samples, one apex.
Where the frame ends
CNI’s graph is closed. An edge exists only when both ends are among the 33 channels. Anything forwarded from outside the roster does not appear. Our forward count is open. It records every source a channel forwards, whether we collect that source or not. Placed side by side, the two pictures agree on the apex and disagree about what stands next to it.
In the FORESIGHT count, the second and fourth most forwarded sources are the Telegram channels of two state television companies, STV News (4,756 forwards) and ONT News (3,831). NEWS.BY and SB.BY follow. None of these four is in CNI’s roster, so in CNI’s tree they do not exist. Further down come Russian nodes: Solovyov (248), Dyukov (174), Sputnik Belarus (126), Korotchenko (98), RT (59). All five personal channels forwarded every one of them. The report’s second wave concluded that the segment did not show a significant dependence on the Russian segment. That conclusion follows from the roster. A graph with no Russian node cannot show dependence on one.
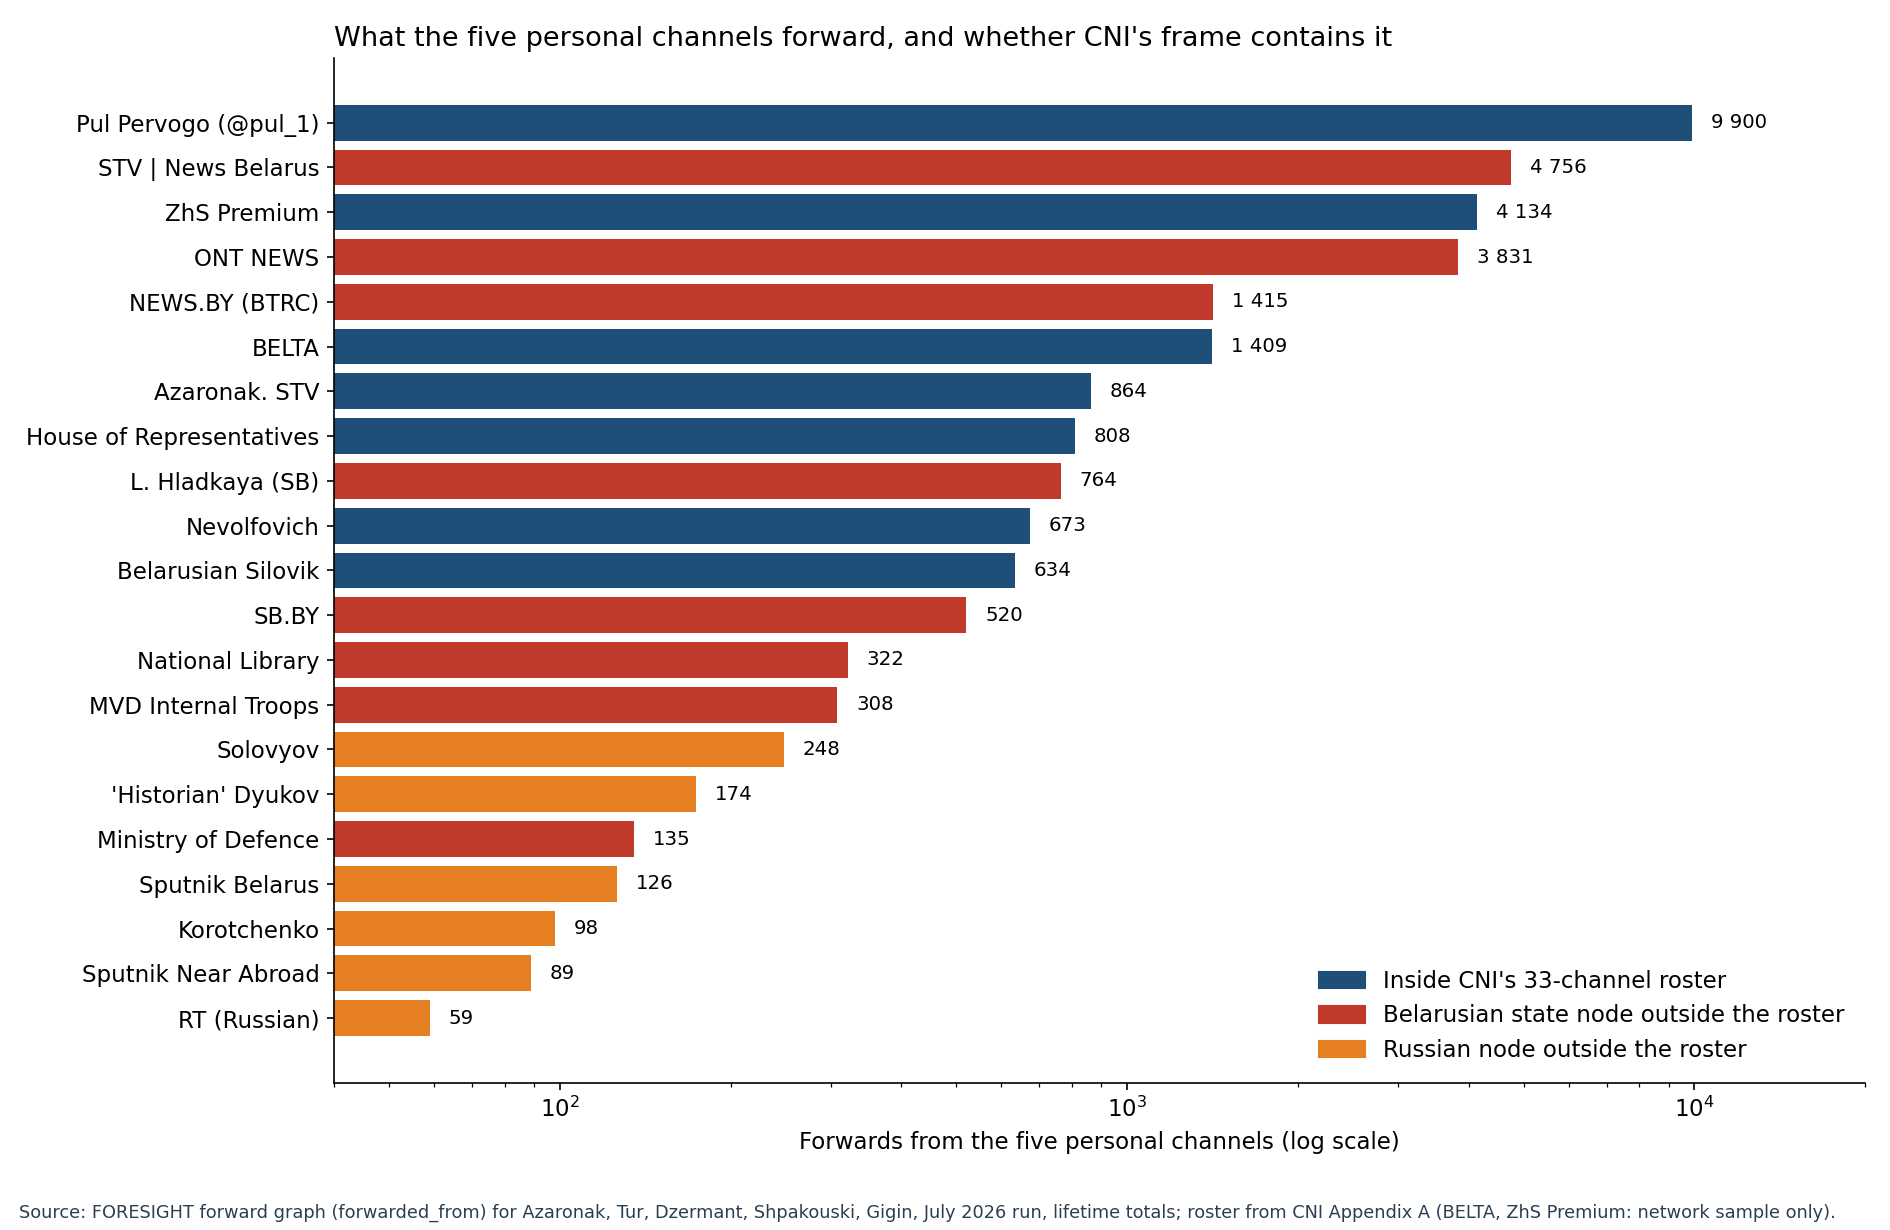
A graph with no Russian node cannot show dependence on one.
There is a second gap, and the report’s own coding exposes it. It finds that 52% of posts are copy-paste or simple aggregation, and that in 34% of posts the original source cannot be identified. A forward graph sees none of that. The 7,395 reposts are 4.3% of the 170,140 posts. The tree is drawn from that 4.3%. The other half of the low-originality content moves along routes the graph cannot see. The reviewer at the webinar, Iryna Sidorskaya, made the same point in different words: the division of functions is proven, the “one editorial office” is not. Proving an editorial office needs timing, not forwards. Same-minute publication across channels is a measurement we have in an earlier FORESIGHT layer, and it belongs in a separate piece.
The number that depends on the clock
The report’s line for the press is that views fell 32%, from about 85 million a month in the first quarter of 2025 to 58 million in March to May 2026, while posting stayed flat (10,789 posts a month at the start, 10,195 at the end). Belarusian Silovik is excluded from that series because it holds 66% of all views on its own and its per-post counts barely vary, which the report reads as administered reach.
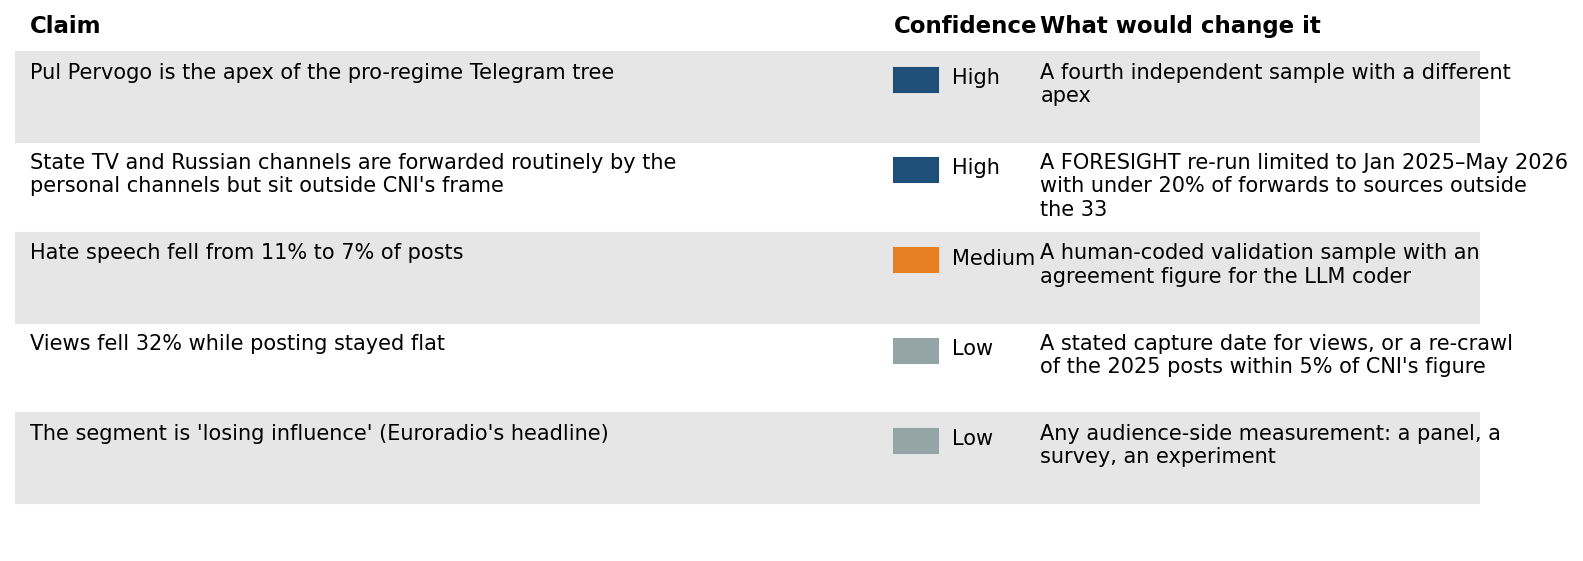
Telegram view counters are cumulative. A post from January 2025 had seventeen months to collect views before the network was crawled in mid-June 2026. A post from May 2026 had weeks. Most views arrive in the first days, but not all of them, and forwards and search keep adding for months. The report does not say when views were captured, so a reader cannot separate audience decline from capture lag. Our own YouTube layer has the same defect, and we wrote it into the Stage 1 design: without a capture timestamp, the indexing date is the only proxy. The direction of the CNI finding is plausible. Its size is not measured.
The direction is plausible. The size is not measured.
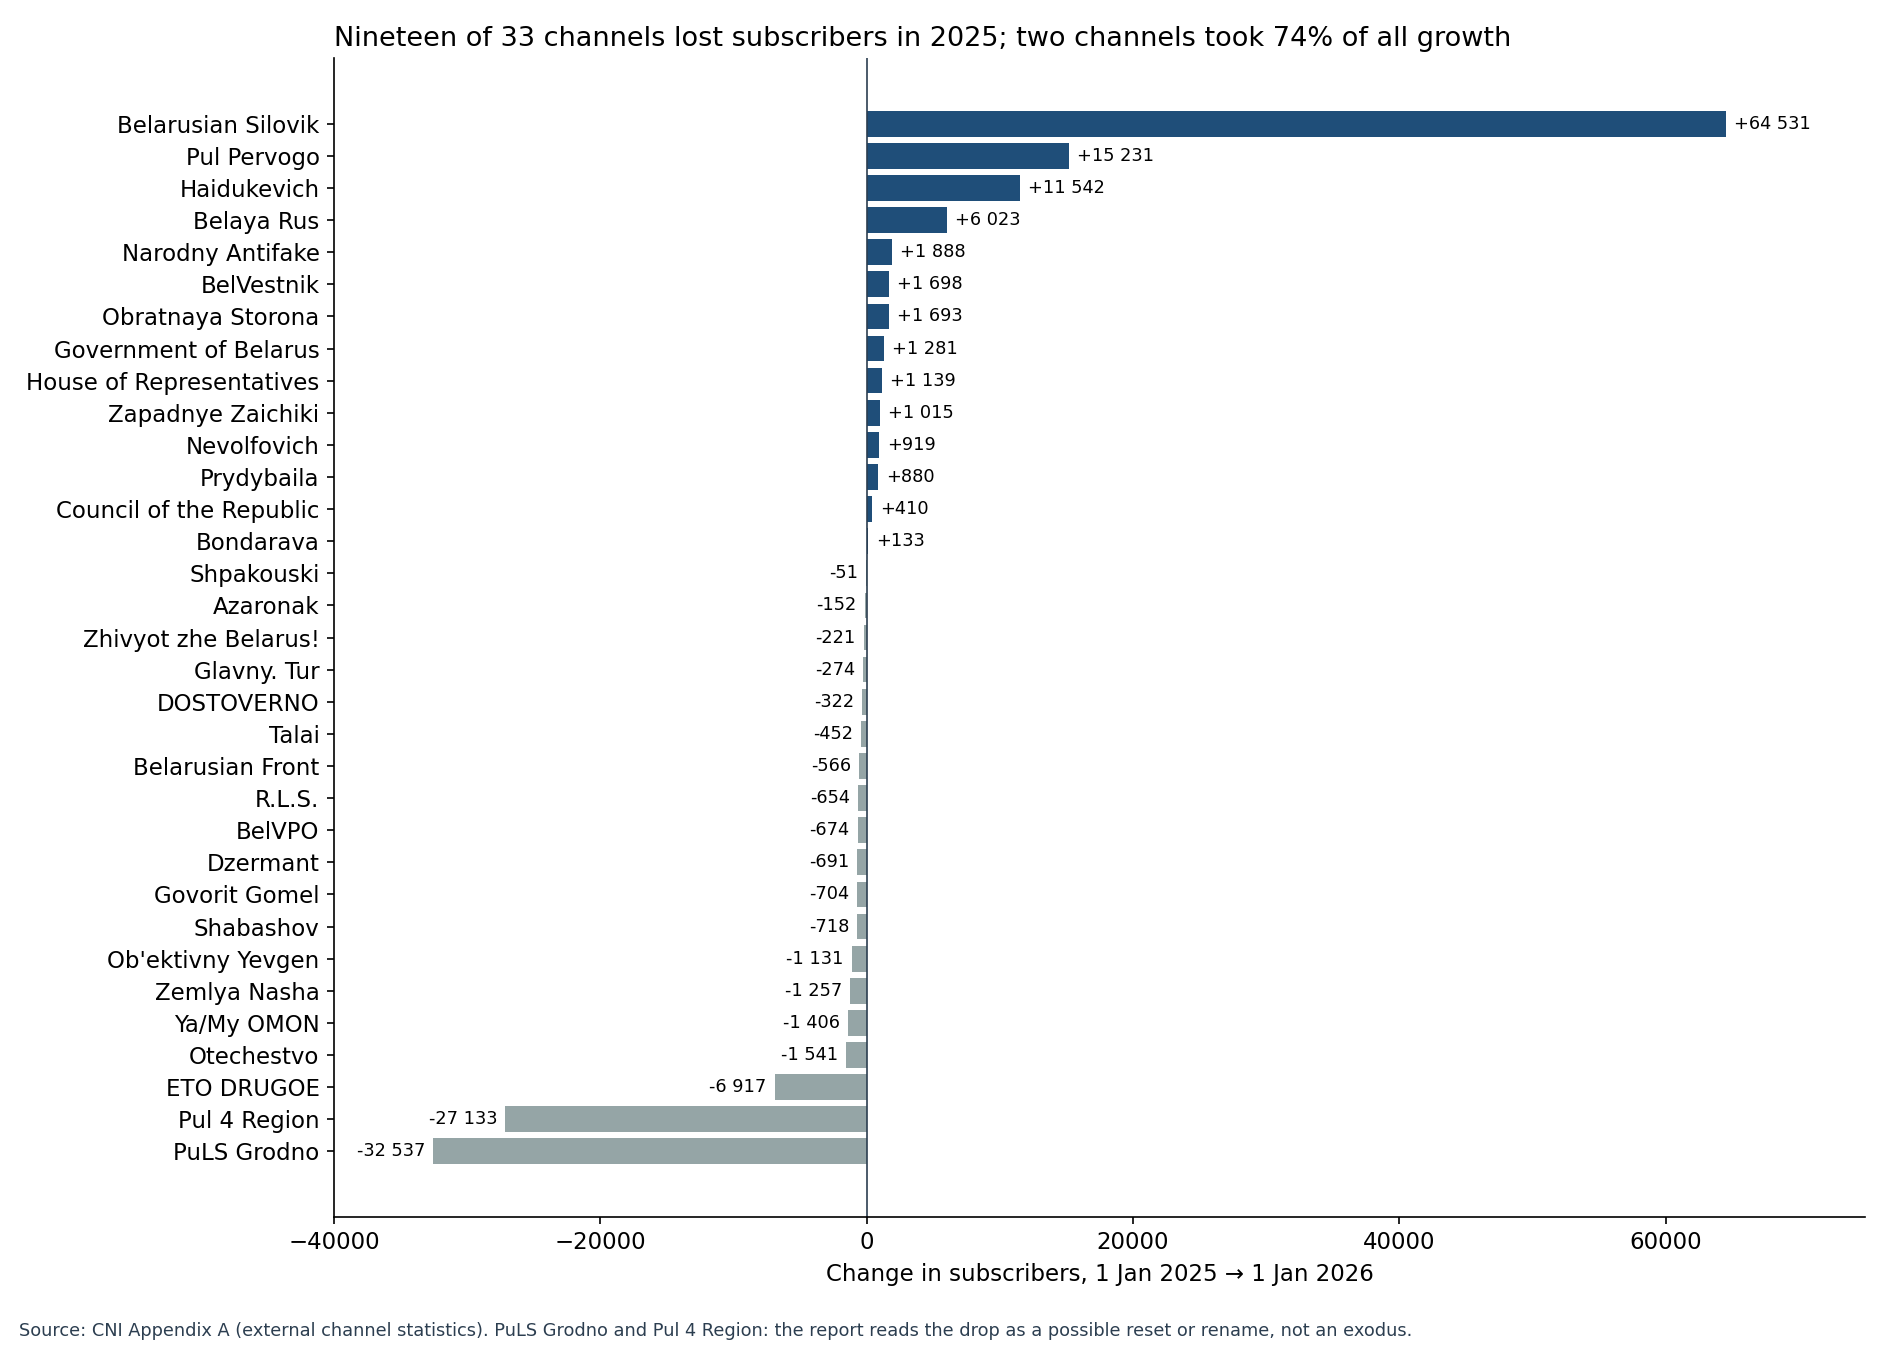
Subscriber counts are cleaner, because they are dated: 1 January 2025, 1 January 2026, May 2026. Nineteen of the 33 channels lost subscribers during 2025. Belarusian Silovik gained 64,531 and Pul Pervogo 15,231, and together the two took 74% of all growth. Two regional channels, PuLS Grodno and Pul 4 Region, lost 27 to 33 thousand each. The report reads that as a reset or rename rather than an exodus, and it is right to hedge.
What the third wave changed
The method moved to LLM coding, the roster grew from 16 channels to 33, and the window from 12 months to 17. The report then compares tone with the second wave across that change: neutral tone dominated then, three near-equal shares now. No validation sample is reported, no agreement figure, no model named. A four-point fall in hate speech, from 11% to 7% of posts, cannot be told from coder drift without one. The shift from domestic to foreign topics (domestic politics 25% to 17%) has the same problem in a different form. Four institutional channels were added to the roster, and the report itself says part of the shift may come from their protocol posts.
The tree is drawn from the 4.3% of posts that were forwards.
None of this makes the tree wrong. Three independent counts put the same channel at the top, and the functional split between positive institutional channels and negative personal ones is the report’s best-supported result. The frame is the issue: the tree has branches that run to state television and to Russian channels, and the frame was drawn before those branches.
Watch items
By 30 September 2026: FORESIGHT re-runs the five-channel forward count restricted to January 2025 to May 2026 and reports the share of forwards going to sources outside CNI’s 33. Expected above 40%. Below 20% and the “closed frame” argument here is overstated.
By 31 May 2027, if wave four runs on the same cadence: Pul Pervogo’s share of intra-network reposts below 55%, continuing the 77% to 59% slope. Above 65% and the report’s “slow diversification” reading reverses.
Any re-crawl of the January to May 2025 posts: views within 5% of CNI’s figure and the capture-lag caveat here falls; a gap above 15% confirms it.
Method and limits. Report figures are from the CNI PDF (September 2026), tables 1 to 5 and Appendix A; the interactive network map is linked from the report by QR code. FORESIGHT figures are from the July 2026 forward-graph run over five personal channels plus NEWS.BY and Pul Pervogo (about 267,000 posts); they are lifetime totals from forwarded_from metadata and are not restricted to CNI’s window, which is why the first watch item exists. DFL figures are from the Human Constanta / Digital Freedoms Lab report covered in “Office Hours”. CNI’s shares are shares of labels for multi-label variables (legitimation, enemy identity, source type) and shares of posts for the rest. Subscriber counts are CNI’s, from external channel statistics that the report does not name.