
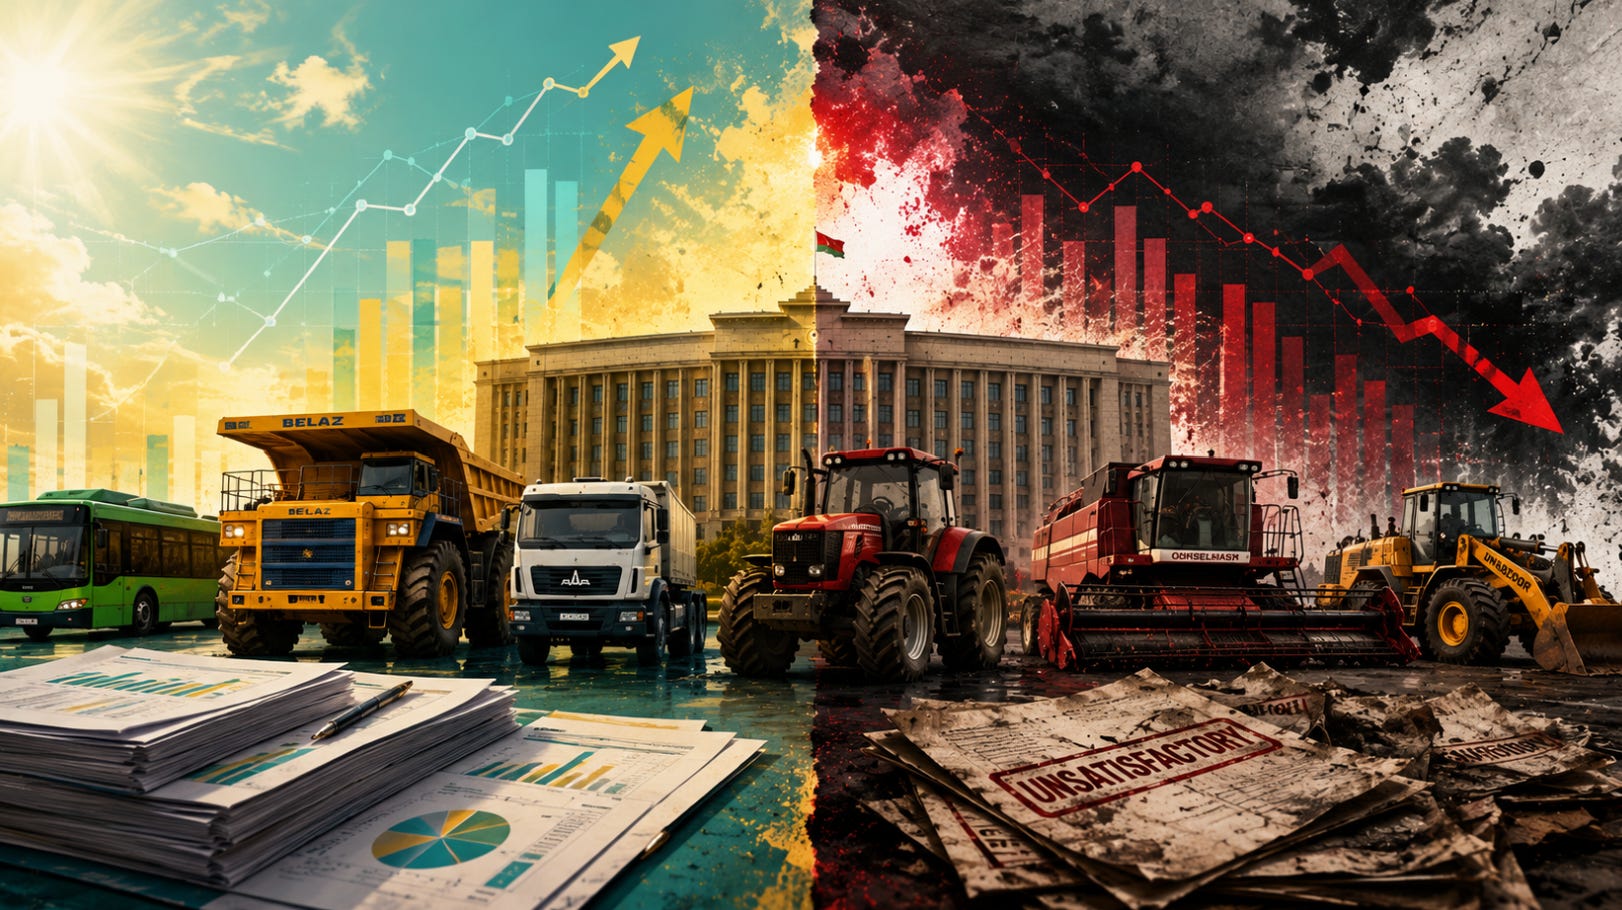
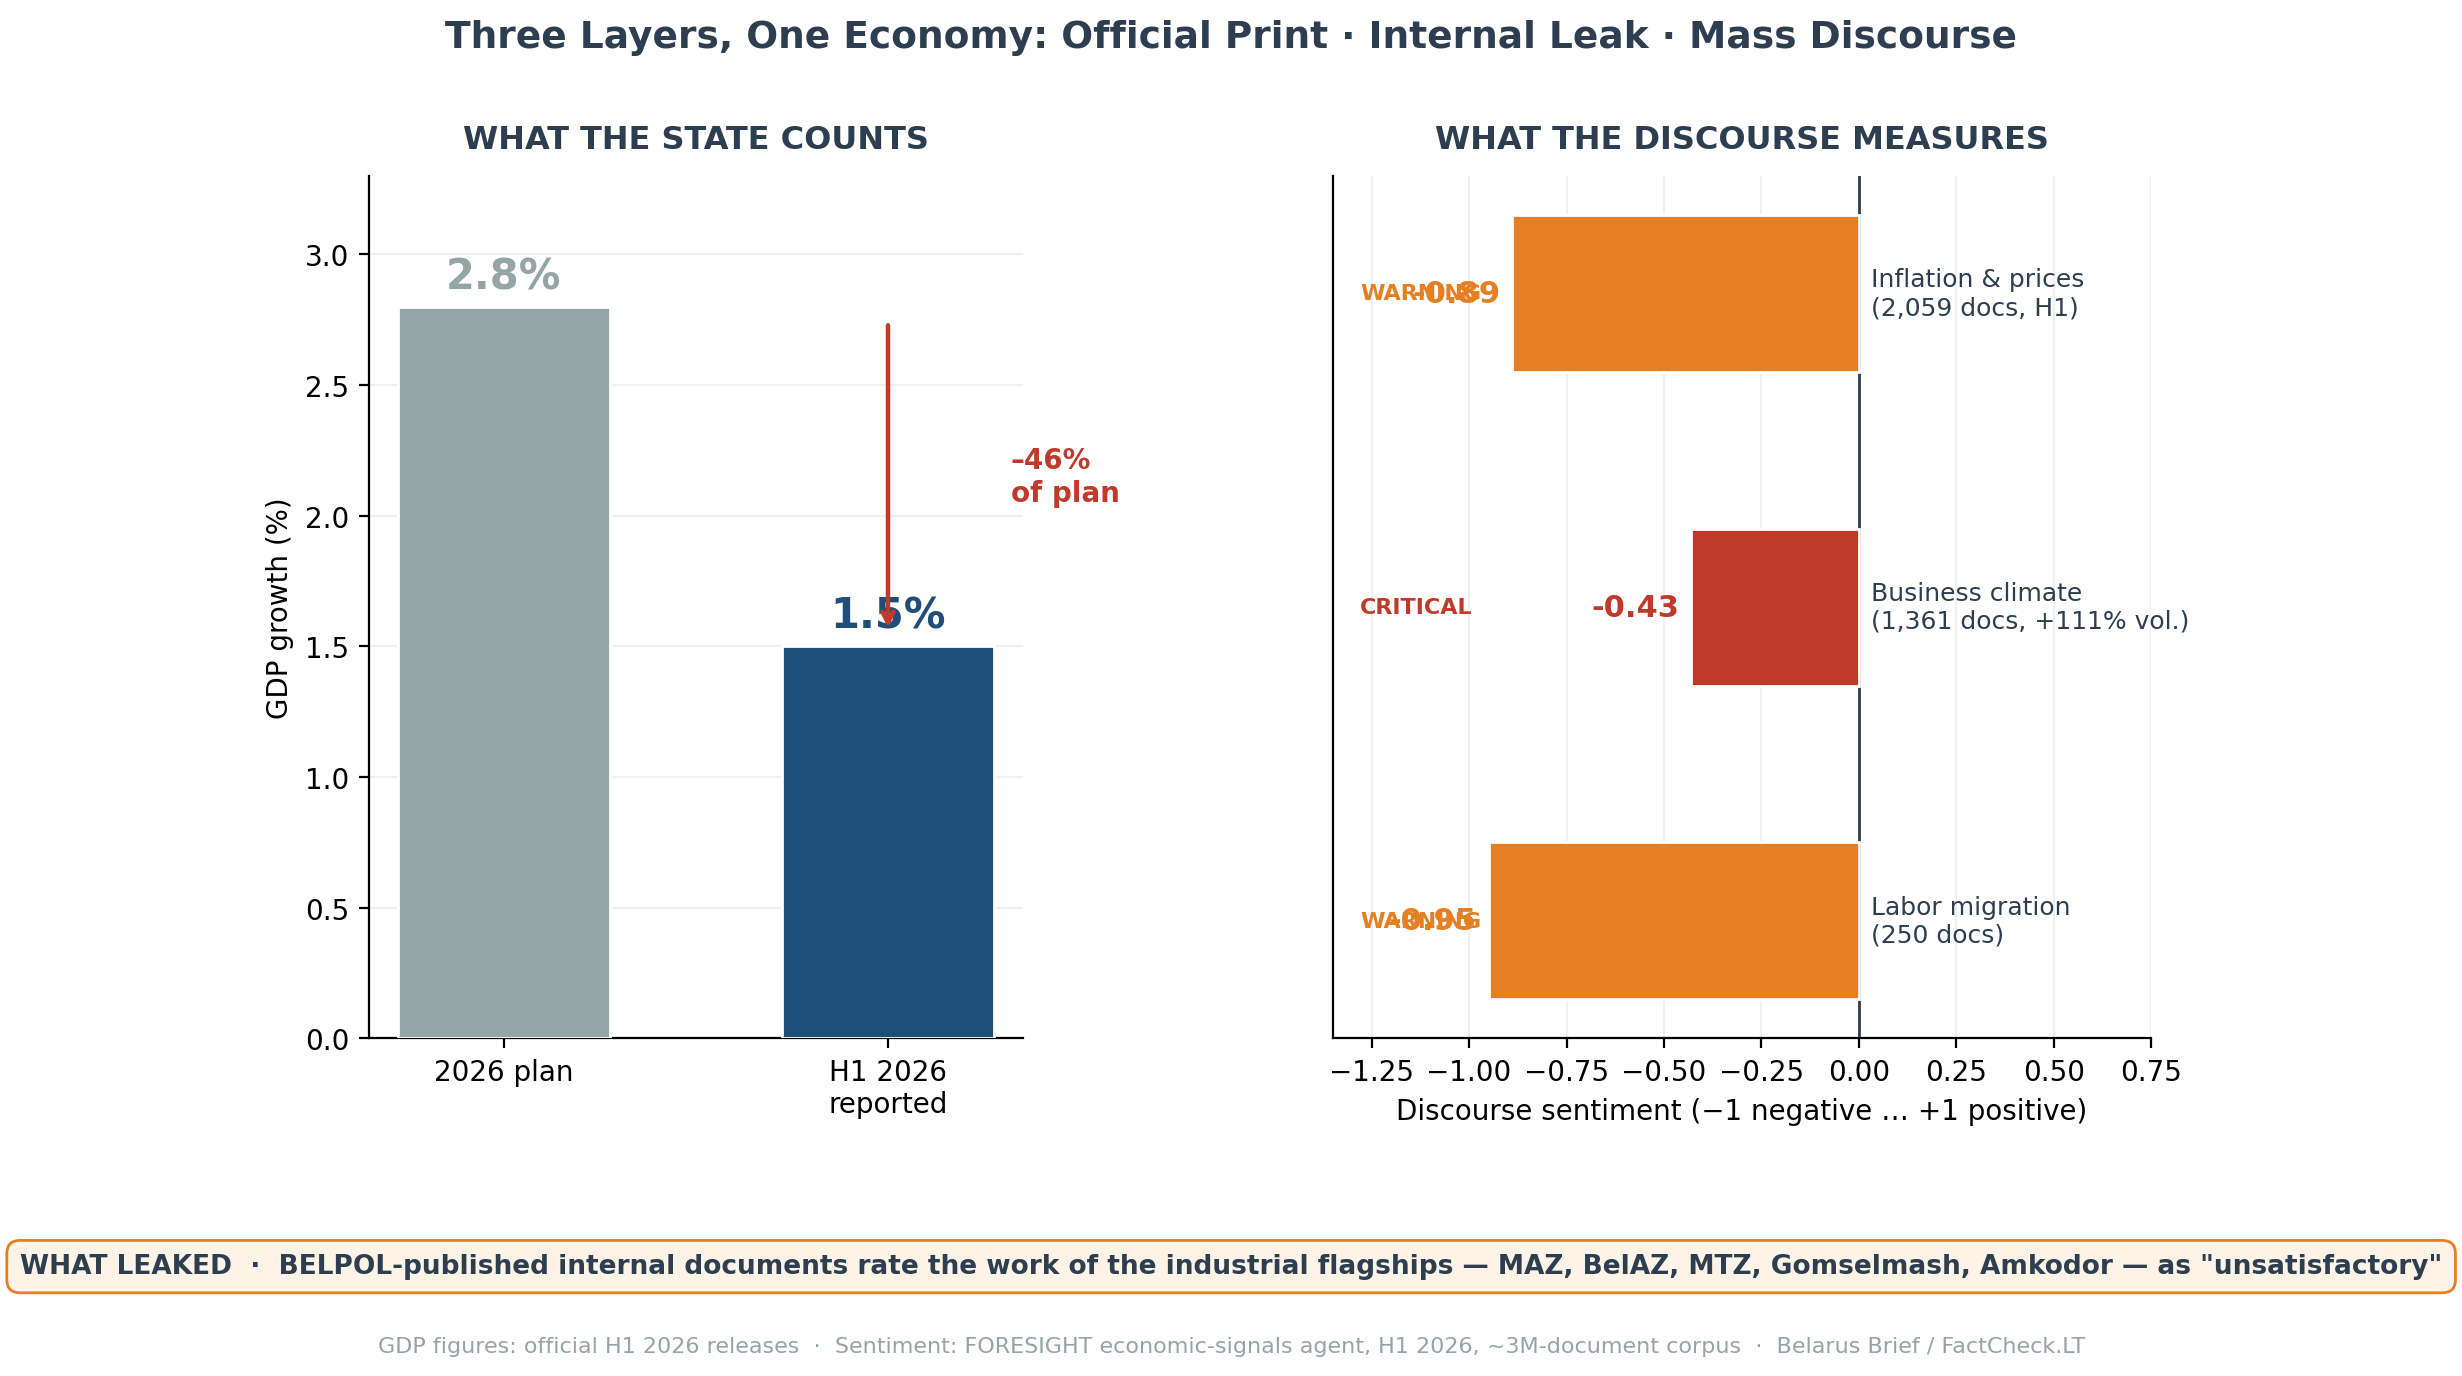
The official half-year number came out in July: GDP up 1.5%, against an annual plan of 2.8%. State outlets wrapped the release in the usual vocabulary of stability. Independent ones did the arithmetic and led with the miss. Worth remembering that 2.8% was already a climbdown; earlier programme documents talked about growth of “at least 4%.”
So far, an ordinary story about an economy underperforming its plan. It gets less ordinary when you ask where the fiscal consequences of that underperformance would normally show up.
We spent this year turning Belstat’s paper archive into a database. 988 publications, 1995 to 2026, just under six million extracted observations, sitting next to the FORESIGHT discourse corpus of about three million media documents. One thing this makes possible is a page-by-page comparison of the same yearbook across editions. We ran it on thirteen editions of “Belarus in Figures,” the state’s flagship annual digest.
The government finance chapter (taxes, budget, public debt) appears in every edition from 2014 through 2022. From the 2023 edition on, it is gone. The energy section lasted two editions, 2021 and 2022, then disappeared the same year. Social protection dropped out earlier. The diff also caught 2,096 cases where a previously published value was quietly changed in a later edition.
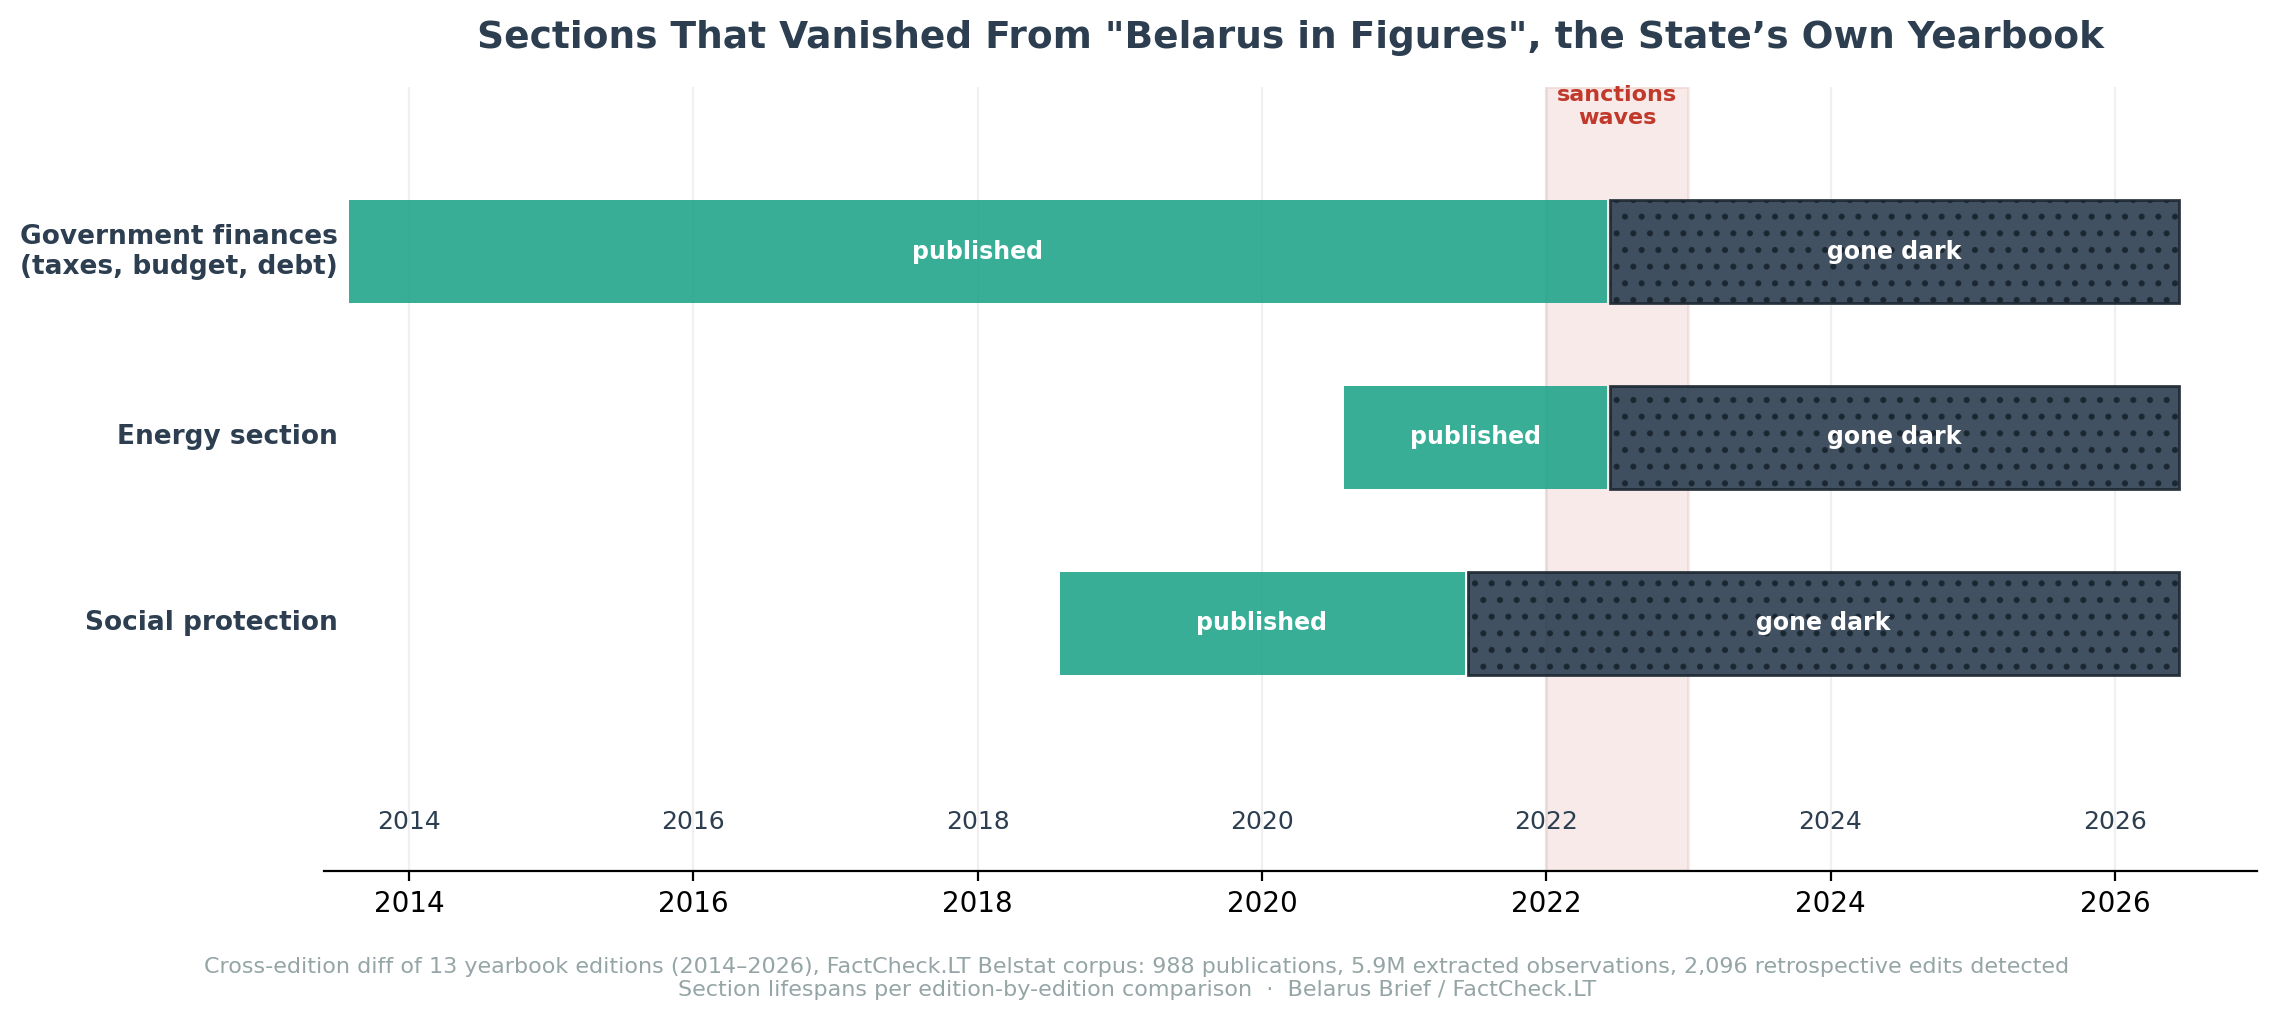
Note the year. The 2023 edition was the first one compiled entirely after the 2022 sanctions waves. Belstat obviously still counts the budget; the finance ministry could not function otherwise. What stopped in 2023 is the showing.
The leak
Some of what internal counting looks like surfaced this month anyway. BELPOL, the association of former security officers, published internal documents in which the work of the big industrial holdings, MAZ, BelAZ, MTZ, Gomselmash and Amkodor, is rated “unsatisfactory.”
A leak is one data point, unverifiable by design, and we treat it accordingly. Its direction is still worth recording, because it points the same way as everything else in this piece. These are the plants that carry the official industrial narrative, and their public numbers used to be checkable against the fiscal chapters that no longer exist.
Meanwhile, the discourse
Whatever gets removed from the statistical record, the information space keeps producing signals, and they can be measured. Our economic-signals agent processed the H1 media flow on eleven indicators. Three stand out.
Inflation: 2,059 documents, sentiment at -0.89 on a scale from -1 to +1. That is the second half-year running at this depth, and the negativity holds in the state segment as well as the independent one. Price growth appears to be the one economic fact no editorial policy has managed to reframe.
Business climate is the only indicator at critical alert. Coverage grew 111% over the half-year with sentiment at -0.43, and state media are themselves among the top sources, mostly through coverage of inspection campaigns and regulatory pressure on what remains of private business.
Labor migration sits at -0.95, the most negative reading on the board. We wrote about that story separately in The Cure Before the Diagnosis.
Why we’re pairing these layers
The point of putting official statistics and discourse data in one database is not to catch a bad quarter. It is that concealment becomes something you can date and describe. For the fiscal chapters we can now say exactly which tables existed, through which edition, and when they stopped; and the media record shows what the surrounding information space was registering while they were dark. The state stopped publishing its finance pages in 2023. The discourse has priced the economy every week since, and the price it shows is negative.
We picked the economy as the pilot because July happened to supply all three layers at once: a print, a leak, and a blackout. The full accounting of the blackout, every vanished section, every frozen indicator on the state data portal, every retrospective edit across three decades, is a longer research paper coming out on FactCheck.LT.
Method notes. Yearbook findings come from an automated cross-edition diff of 13 editions of “Belarus in Figures” (2014–2026) in the FactCheck.LT Belstat corpus (988 publications, 5.9M extracted observations); section-level disappearances were checked against the source PDFs. Only about 2.4% of the corpus’s figures were ever published in machine-readable ruled tables; the rest required positional text reconstruction, which is why we cite structural findings here rather than fine-grained values. GDP figures are the official H1 2026 releases as reported. BELPOL documents are cited as published by the association, without independent verification. Discourse sentiment: FORESIGHT economic-signals agent, H1 2026 run.